The $250,000 Question Every Exploration Company Faces
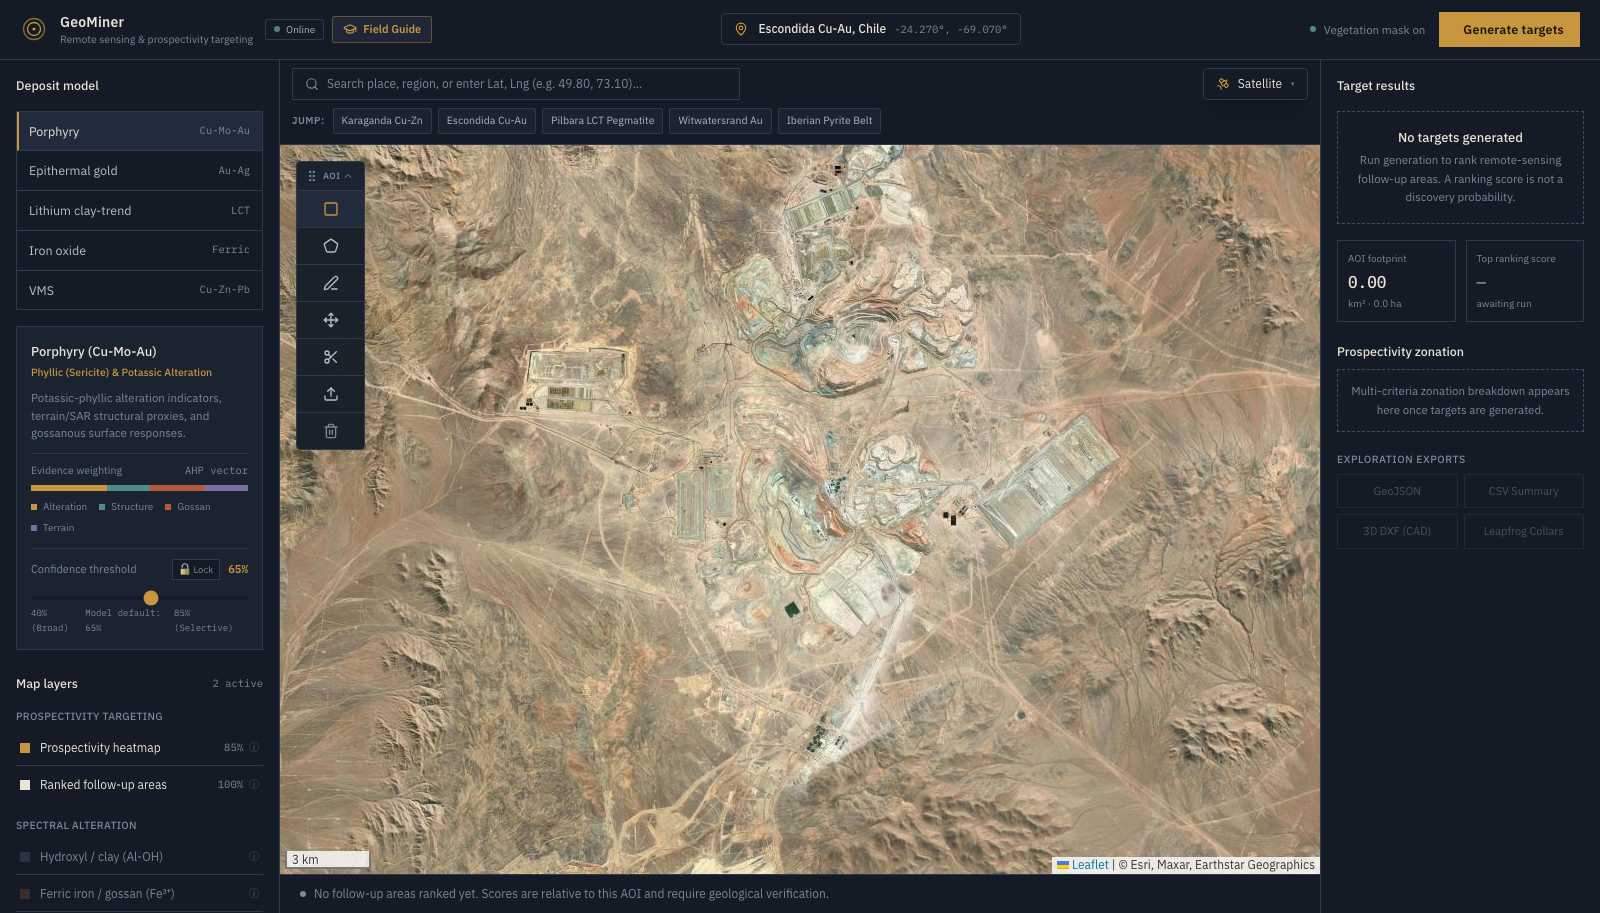
There’s a number that sits behind almost every decision in mineral exploration: $250,000. That’s roughly what a single 500 meter diamond drill hole can cost. How GeoMiner compresses months of regional satellite reconnaissance into hours.
The Ground You Can’t Afford to Search Blind
There’s a number that sits behind almost every decision in mineral exploration: $250,000. That’s roughly what a single 500 meter diamond drill hole can cost. Now stretch that across a license block that spans a few thousand square kilometers, and the math stops working. You can’t drill your way to an answer. You have to earn the right to drill by narrowing the search first, and for most of the industry’s history, that narrowing has been slow, manual, and expensive in its own right.
This is the problem GeoMiner sits in front of.
Where it fits
Exploration tends to move through four rough stages:
- Generative reconnaissance: figuring out roughly where to look across a large area.
- Field ground truthing: soil grids, pXRF, and ground induced polarization surveys.
- Detailed mapping: trenching, outcrop work, and structural audits.
- Drilling: the only stage that actually confirms anything.
GeoMiner operates at that first stage. It’s a cloud-based remote sensing platform built for early-stage exploration and academic geological research, and its job is narrow on purpose: take a regional concession, anywhere from 50 to 5,000 square kilometers, and compress what used to be months of manual GIS work into something that runs in hours. It doesn’t find ore. It finds the top 1 to 5 percent of an area worth sending a field team to first.
Reading rock from orbit
The platform runs on two datasets that already exist for the entire planet: Sentinel-2 multispectral imagery from the European Space Agency, and NASA’s SRTM elevation model, both processed through Google Earth Engine. Nothing exotic, nothing proprietary about the raw inputs. The value is in what gets done with them.
Hydrothermal fluids that form ore deposits leave a signature behind. When they alter host rock and that rock ends up exposed at the surface, the resulting minerals absorb light in specific, measurable ways in the shortwave infrared (SWIR) and visible near-infrared (VNIR) range. GeoMiner picks up on three of these signals through band ratios:
- Hydroxyl & Clay Minerals: Picks up minerals like illite, kaolinite, and sericite using the ratio between two shortwave infrared bands. These are hallmark minerals of phyllic and argillic alteration, the kind of halo you’d expect around a porphyry system.
- Ferric Iron: Looks at the ratio between red and green bands to flag ferric iron (hematite, jarosite, goethite), the rusty oxidation products of weathered sulfides.
- Gossan: Combines shortwave infrared and red to highlight gossan, the dense ironstone crust that often sits above old massive sulfide bodies.
Before any of that gets used, the platform filters out vegetation using NDVI. Anything with dense living cover above a certain threshold gets masked, because chlorophyll reflectance would otherwise bury the rock signal underneath it.
The plumbing matters as much as the chemistry
Spectral signatures alone don’t make a deposit. Ore-forming fluids need a way to travel, which means faults, shear zones, fracture networks—some kind of crustal plumbing.
So GeoMiner also processes elevation data, running directional edge detection across shaded relief to pick up abrupt terrain breaks and fault scarps, then measuring how densely those lineaments cluster. The densest clusters tend to mark fault intersections and dilatational jogs, exactly the kind of structural setting where fluids concentrate and drop their metal load.
It also filters out the terrain that would just add noise:
- Slopes over 35 degrees get excluded because of shadow and rockfall artifacts.
- Flat plains under 5 degrees get excluded too, since those are usually buried under transported alluvium thick enough to hide anything useful underneath.
Different deposits, different rules
A copper porphyry and a lithium pegmatite don’t form the same way, and they don’t look the same from orbit either. GeoMiner accounts for that by running five separate genetic deposit models:
- Porphyry Copper-Gold-Molybdenum
- Epithermal Gold
- Orogenic Gold
- Sedex & VMS
- Lithium Pegmatite Systems
Each model weights the evidence layers differently using an Analytic Hierarchy Process (AHP). Choosing a deposit type in the interface actually changes how the alteration, structure, and terrain layers get combined, not just what label gets applied at the end.
There’s also a practical problem that shows up constantly in satellite-based exploration: active mines look a lot like real targets. Open pits, waste dumps, haul roads, and tailings facilities all expose fresh rock and create sharp spectral and structural anomalies—the same kind of anomalies the model is trying to find. GeoMiner runs a disturbance filter that identifies these zones through terrain gradients, bench terraces, and known infrastructure shapes, routing them out of the results so a field team never gets pointed toward ground that’s already been mined.
From heatmap to field plan
In practice, a geologist draws or enters a boundary, picks a deposit model, sets a confidence threshold somewhere between a broad 40 percent and a tighter 85 percent, and runs the analysis.
The backend pulls the imagery and elevation data, applies the masks and ratios, runs the structural convolutions, weights everything through the chosen genetic model, and strips out disturbed ground. What comes back is a ranked heatmap with target polygons and area statistics, viewable on an interactive map with each evidence layer toggled on or off.
None of that is meant to live only on screen. Results export as:
- GeoJSON for QGIS or ArcGIS
- CSV formatted for Leapfrog collar grids
- DXF for CAD
The output moves directly into whatever software a field team is already running their campaign in.
What it can’t tell you
It’s worth being direct about the limits here, because they matter more than the features do.
Sentinel-2’s sensors read the top few millimeters of exposed rock. They cannot see through hundreds of meters of gravel, alluvium, or caliche to a blind ore body sitting underneath. If the mineralization is fully covered, optical remote sensing has nothing to say about it.
The SWIR bands also operate at 20-meter resolution, so target boundaries are pixel clusters, not surveyed claim lines, and carry a margin of uncertainty at small scales. And a prospectivity score of 0.85 doesn’t mean an 85 percent chance of finding ore; it means the alteration and structural evidence line up strongly under the chosen model. It’s a ranking, not a probability.
That distinction is the whole reason GeoMiner stays at stage one and stops there. It exists to take an area too large to search by hand and hand back a short, ranked list of places worth walking. Everything after that—the soil samples, the geophysics, the trenches, the drill core—still belongs to the people on the ground, because that’s where the answer actually lives.
Explore the live application: GeoMiner Exploration

Written by
Nelson Izah
I write about geology, software engineering, and the spaces where they intersect. When I'm not writing or building, you can find me exploring the outdoors or reading a good book.
There’s a number that sits behind almost every decision in mineral exploration: $250,000. That’s roughly what a single 500 meter diamond drill hole can cost. How GeoMiner compresses months of regional satellite reconnaissance into hours.
Enjoyed this piece?
Leave a reaction to let the author know what resonated with you.
Share Your Thoughts
What resonated with you? I'd love to hear your perspective.